What we offer
Premium custom widgets to visualize metrics, track progress and capacity, and streamline your Agile lifecycle with our ready-to-deploy solutions
Coming Soon
Coming Soon
Coming Soon
Coming Soon
Coming Soon
Coming Soon
Coming Soon
Coming Soon
Coming Soon
Coming Soon
Need something custom built?
Every company has unique needs, whether driven by industry-specific regulations, audit requirements, or simply the way your teams work best. Maybe there's a manual report that could be automated, or a workflow that needs fine-tuning. Whatever the case, we're here to help.
If the data exists in Rally, we can read it, transform it, and present it however you need. With over 12 years of experience customizing Rally workspaces, we know how to tailor solutions that truly meet our customers' needs.
We also convert deprecated custom apps into fully compatible, modern widgets!
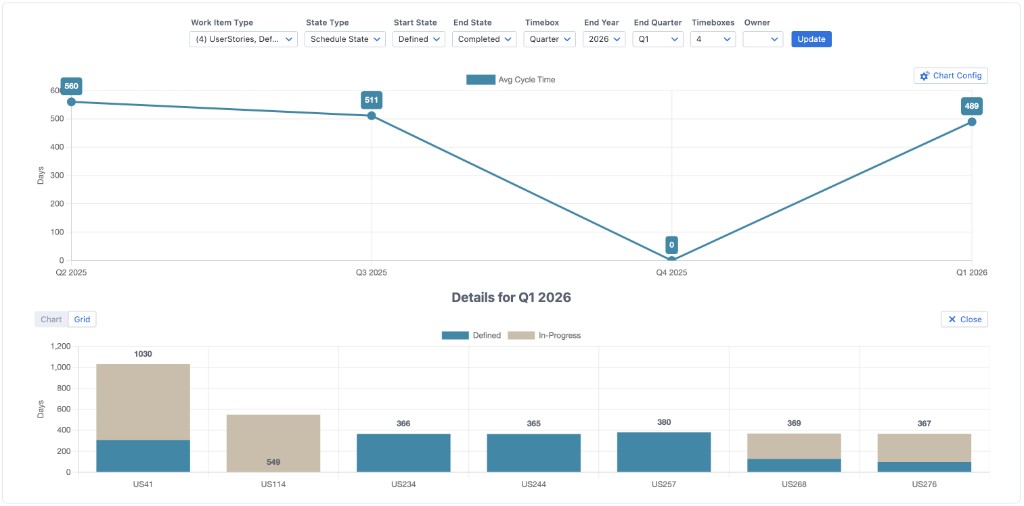
See a recent example: we built a Cycle Time Performance widget for a client to analyze team cycle time over time and measure the impact of new AI capabilities on developer performance. It includes filtering by work item type and owner, grouping by iterations, releases, months or quarters, and drill-down into any data point.